For years, web sites have been measured – and valued – by user traffic. Who is looking at this site? When are they coming, and how long are they staying? Driven by the advertising business model that values “impressions”, web analytics have evolved in a number of ways; the interest has shifted from Passive to Active. Advertisers want to know who is clicking, selecting, comparing, buying, and abandoning. Games track Daily Average Users, Social Networks quantify contributions and visualize connections, in ways that capture the imagination, support valuations, and drive technology change within the enterprise.

That last one – ooo, I just turned down a slightly dodgy alley – because I don’t see that happening IRL.
In the direct-to-my-customer world of the web, a clear understanding of the value proposition (… we get paid when people use the app / site / system …) and the need to understand behavior (… so let’s measure what makes people use it more!) has driven multiple iterations of measurements and metrics, and ever-more intuitive and friendly web sites and mobile apps. Unfortunately, this has led to similar expectations for Enterprise IT, who struggle to keep up with the analytic insight, agile development process, and impactful design skills when working on internal systems.
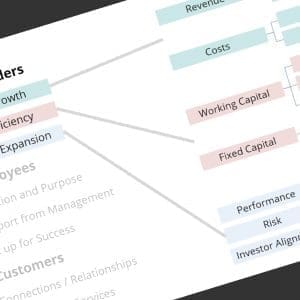
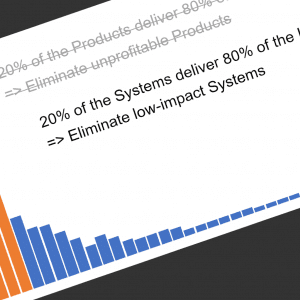
Actually, I think this is a very fortunate turn of events; if Enterprise IT is expected to design and build like a startup, we should start measuring results like one, too. Wouldn’t it be great to get a consistent picture of who is using what systems, and how that is impacting the business? Think about this a second … what if you could clearly identify which systems / processes people are using to drive results? (Bring additional people onto the system, invest [more] in training – and predictably see better results) What about understanding which systems are not being used – could I turn them off, trading a little inconvenience (for the few people using the system) for a lot of cost savings (in maintenance, backup, and other support)?.
It’s an interesting idea – not too complex, but also not very common (at least, I’ve never heard of an IT group correlating usage to results with back-office enterprise systems). Organizations implement systems with high-minded objectives, struggle through the implementation and the new requirements for data and process rigor, and continue to use them based on custom and faith because we spent so much putting them in – and we don’t have the time to imagine any other way of doing things.
Wouldn’t it be better to have conversations like this …
- Sales Group West is leading the way, and they use the CRM system every day. Sales Group South is behind – and they are not using the reports and data and work flows that Group West is using. Is there a correlation? Let’s talk specifically about how Group West is leveraging the system – and what Group South can do differently.
- We expected direct labor costs to decrease after implementing the shop floor tracking process – and it is not changing for any of our plants. Can just rip out the material handling automation and go back to visual systems?
- Site A has better inventory control metrics then the other plants – and they are using more of the ERP functions. Can we talk with the local folks and drill into the connection between the transactions they use and their inventory levels?
I don’t assume that tracking the Who, What, and When of our users is going to immediately show results. I aspire to show Correlation, not Causation – and start some thoughtful discussions. Of course, there is a bit of mystery in all of this – what if we cannot see any patterns in the utilization data? What if the different users and groups have other things going on that muddle and mask our ability to measure the impact of our systems? Not sure, but I expect it will be an interesting journey.
There are a couple of things to think about here …
- How to measure Utilization simply and consistently – and why
- How to define and compare Results across multiple systems, multiple user groups
- How to represent Utilization versus Results to show Correlation, and shed a light on Causation
I will expand on these topics in my next few posts.


Comments (0)